
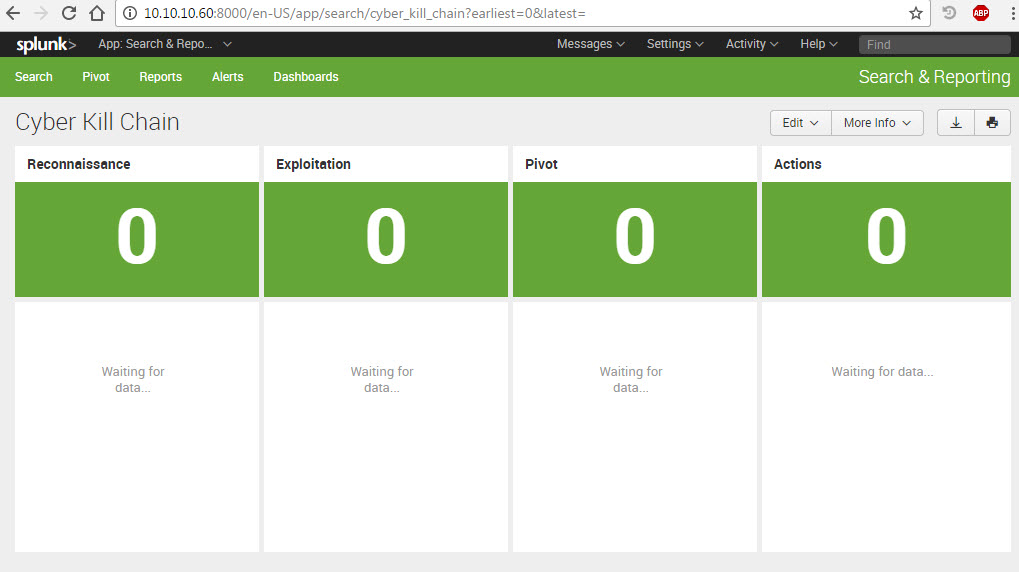
The center piece of this demonstration is the Splunk Dashboard. The idea is to provide clear indicators when things are good (green) or bad (red) during the demo. In Part 1 we discussed the Cyber Kill Chain in 4 phases, so we will build a Splunk Dashboard that shows those 4 phases clearly.
Installing Splunk

As with all of the previous installs, the first step is to download the install file. The install file that will be used here is the Splunk Enterprise for Linux with 2.6+ Kernel (64-bit). Choose the latest version (I chose 6.4.1), download the RPM file and move it onto your Utility VM. Once it’s on the Utility VM you can install it with the following command.
sudo rpm --nodeps -i [filename]
For example, the command I entered was
sudo rpm --nodeps -i splunk-6.4.1-debde650d26e-linux-2.6-x86_64.rpm

Once the install is complete we need to make one change to the default configuration. In the demo dashboard that will be created, we will need to be able to run 8 concurrent real-time searches, so we need to up the search maximums. Using you favorite Linux editor, edit the following file: /opt/splunk/etc/system/default/limits.conf. You must use sudo to edit the file because it’s writable only by root. Search the file for “max_searches_per_cpu” and set that value to 4, then save the file.
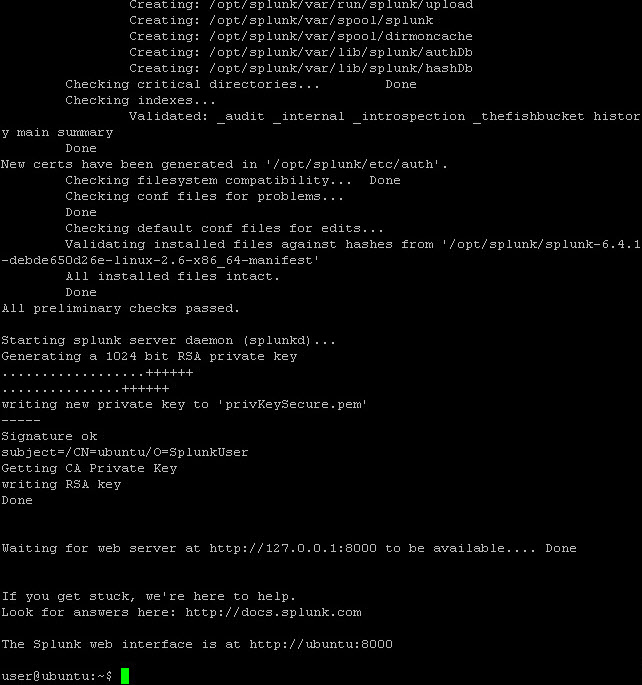
We are now ready to start Splunk for the first time. Enter the following command.
sudo /opt/splunk/bin/splunk start
Answer any questions about licenses. When all is done, you should see a message that Splunk web interface is started.
Use your browser and surf to the Utility VM’s address http://10.10.10.60:8000 and sign in for the first time.
Change License
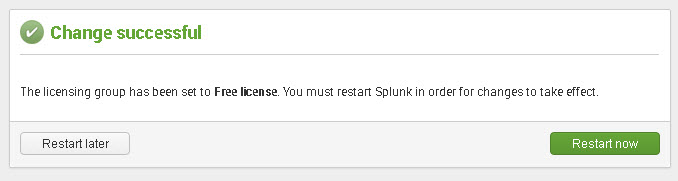
Click on Settings at the top right then Licenses. We want to change to the Free license group (unless you have a valid license). Click on Change license group, then select on Free License and click Save. You will be required to restart Splunk so click Restart Now. Once Splunk starts again, you can click on sign-in (no need to authenticate) and we are ready to continue.
Adding Data Feeds
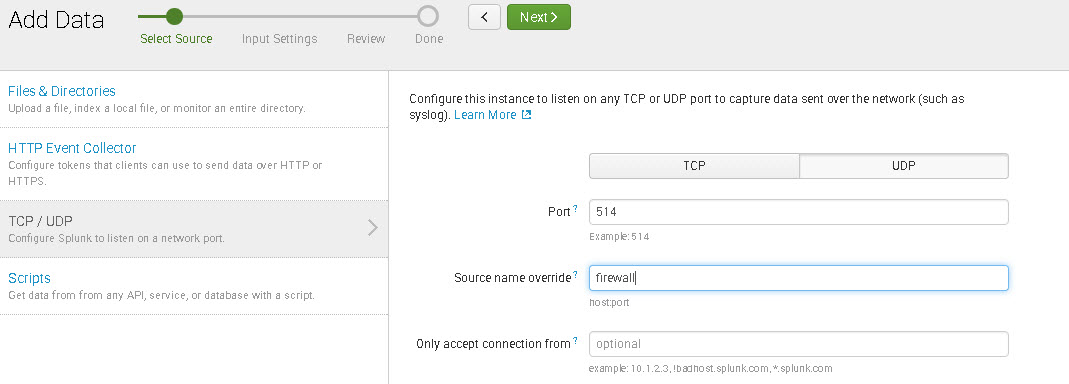
Click on Settings at the top right, then Data Input, you will be presented with a list of data types, click on UDP. Click on the Green New Button. For the port use 514, for Source Name Override use firewall, then click on Next. For Source Type select from the list Miscellaneous then generic_single_line. Leave the App Context alone, for Host select Custom Method and enter firewall. Click on the Green Review and if all looks ok, click on Submit. That takes care of the firewall logs.
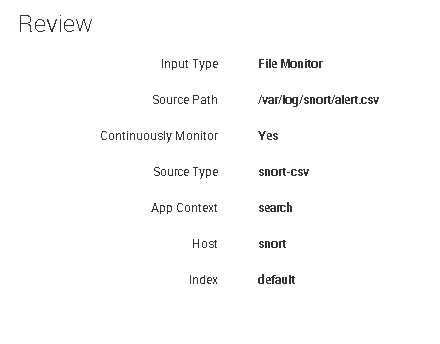
Now to add the IDS logs. Click on Settings at the top right, then Data Input, you will be presented with a list of data types, click on Files & Directories. For the File or Directory enter /var/log/snort/alert.csv then click Next. For the Sourcetype click the pull down and select Network & Security then snort-csv then click Next. Set the Host value to Constant Value and set the field to snort then Click on the Green Review and if all looks ok, click on Submit. That takes care of the IDS logs.
Demonstration Dashboard
The next step is to create the demonstration dashboard. To do this we will use two basic seaches: the firewall logs and the snort logs. I’ll show you the basic searches for all four of the Cyber Kill Chain searches, then we’ll put them into a dashboard. Their usage will become apparent once we build the Attack VM and test the attack sequences.
| Reconnaissance | host=firewall block 192.168.1.128 |
| Exploitation | host=snort “192.168.1.128,7001,10.10.10.128” |
| Pivot | host=snort “192.168.1.128,7002,10.10.10.128” |
| Actions | host=snort “192.168.1.128,7003,10.10.10.128” |
The easiest way to build the dashboard is for me to provide you with the XML. Click on Dashboards at the top of the search screen, click Create New Dashboard, name it Cyber Kill Chain then click Create Dashboard. Now click Edit Source at the top right and paste the following XML into the source and click Save.
Splunk Operations
The final thing we need to do is clear the Splunk data for each demo. The easiest way to do that is with a script. Log into the Utility VM, then using you favorite Linux editor, edit the following file: /home/user/clearSplunk.sh and enter the following lines.
/opt/splunk/bin/splunk stop
/opt/splunk/bin/splunk clean all
/opt/splunk/bin/splunk start
Save the file then enter the following on the Linux shell.
chmod +x /home/user/clearSplunk.sh
You can now stop, clear the splunk data and start Splunk again using this command.
sudo /home/user/clearSplunk.sh
Next Time
In the next two installments we will build the Victim VM and the Attacker VM. Once the attacker VM is built we can run the attack sequences and see the results on the Splunk dashboard. Then the final installment of this series will wrap then entire thing up with a walk-though script.
Question, comments and discussion wanted? Replies are always welcome.